Dashboard overview
The Dashboard is your real-time view of AP operations. It shows how invoices are flowing, what needs attention, and how the team is performing.
Open the dashboard
Click Dashboard in the left sidebar. The page loads with data for your current entity and the default date range.
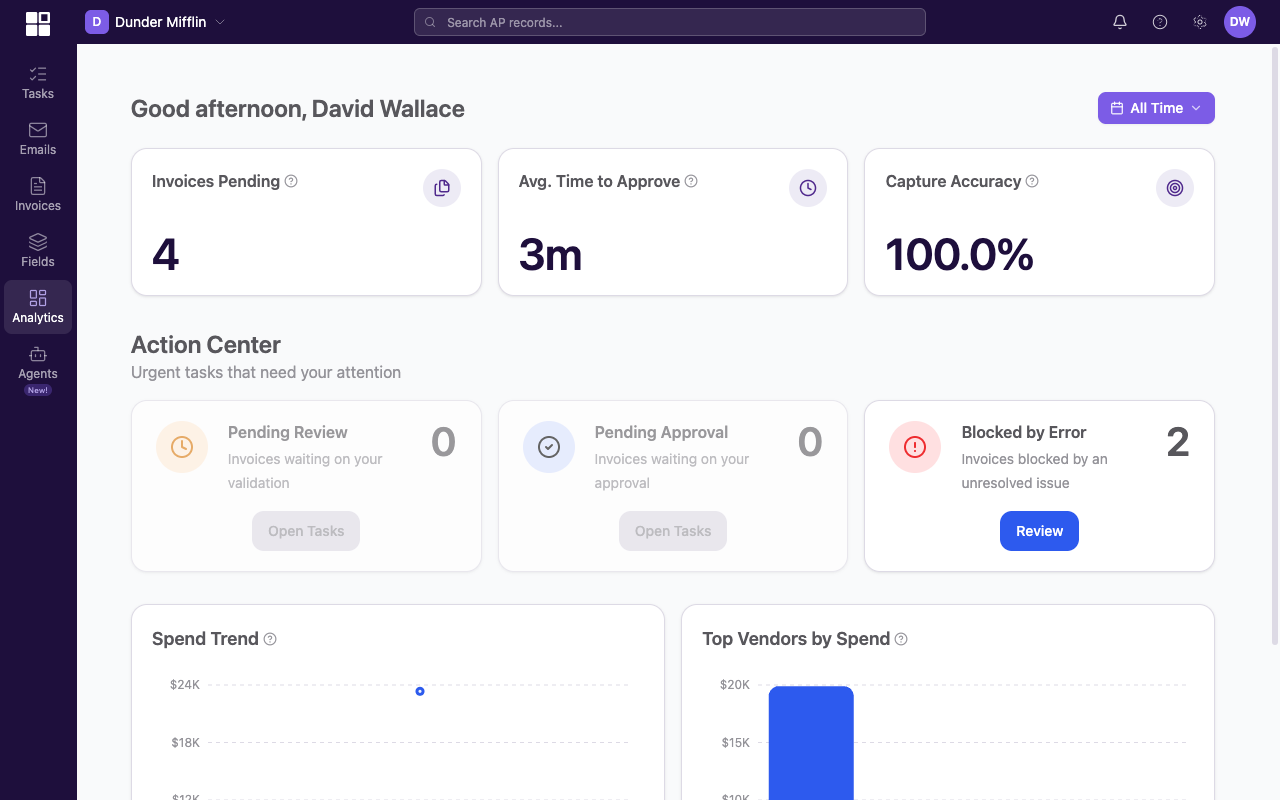
Dashboard for the current entity showing KPI cards, the Action Center, and Spend Trend + Top Vendors charts.
Cards
The top of the page renders a row of three KPI cards:
| Card | What it shows |
|---|---|
| Invoices Pending | Invoices still waiting somewhere in the review workflow. |
| Avg. Time to Approve | Average time from invoice creation to approval. |
| Capture Accuracy | How often invoice data is extracted correctly on the first pass. |
Each card shows a change delta against the same-length previous period. A positive delta means the metric went up; a negative delta means it went down. See Dashboard Metrics for definitions.
Date range
The date picker sits above the cards. The options are Today, Last 7 Days, Last 30 Days, This Month, Last Month, This Quarter, This Year, and Custom Range. Changing the range refreshes every card and chart on the page.
Action Center
Below the cards, the Action Center groups items that need a person to act. It shows invoices in error, invoices missing critical fields, and approvals that have been waiting too long. Each row links to the affected document.
Charts
The Dashboard renders two main charts below the KPI cards:
- Spend Trend: monthly invoice spend over the selected period.
- Top Vendors by Spend: your highest-spend vendors for the selected period.
Supporting stats (Invoice Status breakdown, Invoices With Errors, Notice Distribution) feed the Action Center rather than appearing as standalone visible charts.
Check the Dashboard daily to stay on top of pending approvals and processing errors. A quick scan of the cards and the Action Center is enough to catch issues early.
Multiple entities
If you have access to more than one entity, switch between them using the company switcher in the top bar. Each entity's Dashboard is scoped to that entity. For a cross-entity view, switch entities with the company switcher and compare.